Have you ever come across this kind of datasheet?
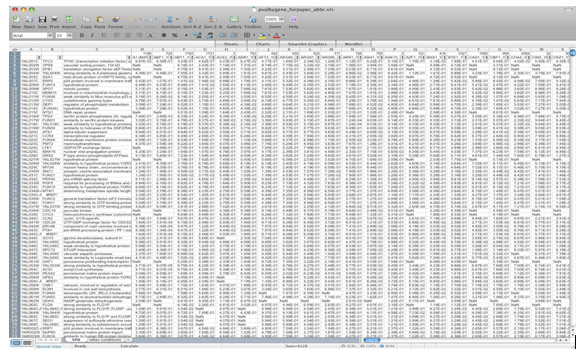
Source
Probably yes.
Then you know that comprehending such information can be tedious.
Now, imagine information in the form of pie, tables, lines, bars, dots, slices, icons, and others.
Don’t you think it will be much easier to understand?
If you are thinking yes, then you should also know that in the world full of data, the picture is worth way more than thousands or millions of words.
Why is this?
This is because our brains are these giant image processors. According to a study, 90% of the information transmitted to the brain in the form of visual data.
In the world where artificial intelligence rules, big data has become the lifeline of companies. Hence, if any businesses want to empower their teams, they need the correct data and ways to properly interpret it.
Visualization can provide you with one such power that is a solution to the biggest issues of misalignment between sales and marketing. But first, you should know the reason behind the rift which is a lack of comprehension about each other’s work.
For instance, if a sales team is not closing new business, they blame marketing teams for bringing low-quality leads. On the other hand, the marketing team blames the sales and development process.
This is the place where data visualization enters.
By, tapping into visualization you can create representations of data that appeal to the brain. It will align both of your sales and marketing teams and help them understand how the other words. We’ll see more about this below.
Till then let’s quickly understand a little more about data visualization.
What is Data Visualization?
Data visualization is the study of the representation of data by using a visual or artistic approach.
The two of the most popular types of data visualizations are dashboards and infographics. Both use a combination of charts, text, and images to interpret data.
They transform data into meaningful and useful information via some form of visualization called Business Intelligence (BI).
This is pretty much what you need to know about data visualization. You’ll find the answers to all your questions below.
So, here are some of the data visualization techniques to help you enhance your sales and marketing team.
What Can Data Visualization Do for Your Sales Department?

1. Keep Track of Trends
We all know how the sales and marketing teams. One major aspect of their work is to stay updated with new trends. This is because even a slight spike in the data might require immediate and prompt action.
They need to be constantly updated with data as soon as possible. But, in such a case reading thousands of spreadsheets or entries won’t do any good.
Hence, data visualization can be an enormous help. For instance, a waterfall chart can be used to track changes over a specific period, for example, blog traffic.
Let’s understand it deeper, information on the blog showing a 28% increase in views though a waterfall chart and 60% of all website visits through a bar/line chart can help a sales analyst conclude that blog posts are driving healthy increase traffic.
It will be highly unlike a data-sheet filled with numbers which will take a lot of time to figure.
2. Productivity
A report says data visualization tools have 28% more chance to find information on time than those who rely on reporting. This will also mean that your employees can spend more time being productive with the capability to visualize data.
The report also concludes, about 48% of business intelligence users rely on visual data discovery to find the information without the help of IT staff.
Hence, if you are a firm that wants to increase the productivity of your staff, it might be helpful to decrease the load on them.
With the help of data visualization tools and software, you can increase the productivity of your employees.
3. Swift Response
The human brain can process images 60,000 times faster than numerical or textual information.
Data visualization can bring a new level of clarity and transparency which can enormously help decision-makers in the sales department to make informed and swift decisions.
For instance, a sales manager who receives the information on time is capable of managing sales activities and notifying other parties related to the CRM.
Visualization fosters fluidity between teams to make sure that all the necessary actions are taken in a timely manner.
Therefore, if you are a company that struggles with balancing both sales and marketing teams, it might be better for you to opt for data visualization. It will help your clarity and transparency in data sharing and decision making.
4. Data Integration from Several Sources
We all know how different sales and marketing team’s work. But, more often than not we fail to realize they use different tools for the collection and interpretation of data.
The integration of data is important because it brings all the data in one place, meaning it is all accessible in one place. This also means that both of your teams will know what the other team is looking at, making communication clearer.
Hence, another crucial aspect of data visualization is improved integration of data. Data visualization software solutions create a common platform that integrates data of sales and marketing teams.
Lastly, with clear data visualization, the impact of data on sales and marketing activities can be analyzed to further help in differentiate patterns based on activities.
So, if you are struggling with the management of data and find it all over the place then you know what you need to opt for.
5. Communications
“Any problem, big or small, within a family, always seems to start with bad communication. Someone isn’t listening.” – Emma Thompson
Communication is a big problem for all businesses. Both businesses and employees suffer due to poor communication and to reduce this gap, businesses can make sure that your teams are using the same analytics tool.
How will this help?
Using the same data visualization and analytics tool will provide them with the same information. This will give them enough transparency and they will interpret the data in the same way.
There is also another way data visualization can improve communication. If a manager wants to tell a sales rep about what they are doing wrong, visual communication will help him/her understand it much faster.
Let’s take an example, executive officers want to know high-level information and you have to provide them with a proper report. What is the major problem you will face?
For one it can be that these reports are time-consuming to create and can be confusing to read for them.
What will you do?
Data visualization can help you solve this problem, actually the problem of both parties by empowering sales managers to communicate more clearly. At the same time, the executive can use visualization to find improvement.
6. Track Goals and Results
Have you ever found yourself not aligned with your goals because you lost track or maybe your daily, weekly, and monthly goals are all over the place?
Then data visualization is for you!
Visual representation of data can be very effective to help monitor progress especially when you have more than one business goal.
For example, data visualization can help monitor sales performance for revenue, the status of the deals in the funnel, and the percentage of closed deals.
Having everything in one place provides ease in accessibility, at the same time clear and concise data provides easy to understand information.
This provides sales managers with insight which then helps them take specific goal-focused actions.
An example of such action can be directing the team to generate more deals from those that remain in the negotiation phase.
7. Reporting and Monitoring Client’s Accounts

Companies that generally have to manage client’s accounts such as inbound marketing agencies can easily monitor reports.
For account managers consulting multiple accounts and monitoring their sales and marketing KPIs on a daily, weekly, and monthly basis to track goals can be tough.
Data visualization can help us combine information from multiple accounts in one. This enables teams to view the results of all accounts in one and assess priorities for actions.
Bottom line:
The world is moving fast and most of us don’t have the time and patience to browse through hundreds of documents for information. Data visualization can help us solve this problem by making data simple to read and understand.
If you want to leverage the benefits of data visualization in your firm there are several data visualization tools you will find out there.
In this blog, we have shared some data visualization techniques which will help you boost your sales and marketing teams.
Data visualization is an important tool and using is right will give you unprecedented power over your data.


 How To Sync Data Between Android And Mac?