Robin Khokhar
Robin Khokhar is an SEO specialist who mostly writes on SEO. Thus sharing tips and tricks related to SEO, WordPress, blogging, and digital marketing, and related topics.

An infographic is a visual content format that presents information and data with texts, images, illustrations, graphics, and icons. It helps readers...

Image Credits: pexels
Reply

An infographic is a visual content format that presents information and data with texts, images, illustrations, graphics, and icons. It helps readers understand since it summarizes various data and information in one picture. Infographics for content marketing is very important because it gives clarity to the reader.
It is the kind of resource that is most successful in content marketing strategy. In addition to enriching the content, it contributes to the excellent user experience on your site page. On the one hand, it contains essential information for your audience; on the other hand, it is useful to direct reading more pleasantly and intuitively.

The simplest explanation for using infographics is that they make any content more engaging, and perfectly adaptable for any business model. And here are some other reasons:
But do you need to be or have a designer to create infographics for content marketing? Not really! Although hiring someone specialized is always the best option, it is also possible to make an infographic without spending a lot, using tools available on the internet.
Want to know how? Keep reading this text until the end!
Here are three simple steps to make an infographic for your personal use or marketing use.
If you want to explain something complicated simply, you need – in the first place – to gather all the data and images you want to use in the infographic, a spreadsheet of data, a brand logo, some icons, etc. After gathering all the data and materials, you outline your ideas and order them one by one in the design.
Okay, you’re not a designer. You don’t know what a colour palette is, and your heart races just thinking about editing anything. Do not worry. We are together, and I will show you how important, easy and fun to make an infographic with an online designer, DesignCap Infographic Maker.

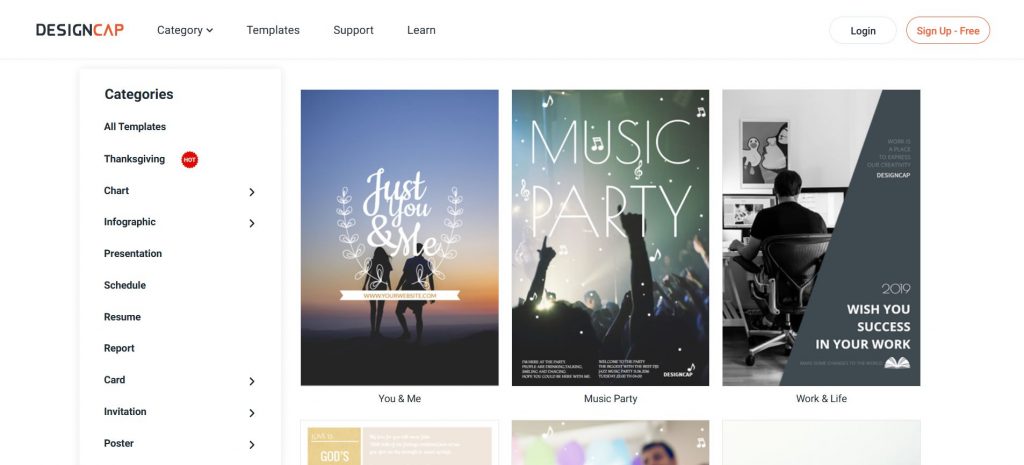
The DesignCap.com is a free online app that allows you to create graphic materials. Click the “Get Started Now” button to enter its template page. You will see thousands of templates divided into many different categories and sub-categories like infographics, presentations, charts, coronavirus, invitations, YouTube channel art, YouTube thumbnails, Instagram posts, Facebook covers, etc. Here pick an infographic and choose a specific one to start editing.
Choosing a template will make the whole process easy to create. If your infographic is going to be a “step-by-step,” for example, it is worth looking for a template that already includes spaces that signal these steps. If you want to do something that explores data and numbers, look for a template with charts. Don’t worry that the template is not 100% unique to what you would like, as you can edit all content later.
Leave your sketch aside and start replacing all the texts and images in your infographic. After placing the text inside, it is time to position and organize the texts and data. To move texts around, drag the text box. To format the texts, click on the text box and access the toolbar to edit the font, size, and colour of the characters. If you are not satisfied with the preset fonts, upload your own since DesignCap offers you the option to upload users’ fonts from the computer.
If you want, place some icons to facilitate the understanding of your infographic. Look for icons that will make your material easier to read. DesignCap allows you to add stock photos and icons from its millions of online resources. And you can upload your own from your computer as well. Then change its colour, opacity, and size to meet your needs.
If you have much data to display in the infographic, use a chart to show them simply. With DesignCap’s Chart feature, you can import your data directly from a file format of CSV, XLSX, or XLS to the chart and display them concisely. You can choose a chart type from the several preset ones such as line, pie, table, map, bar, etc.
Once everything looks great, save the infographic as an image file or share it anywhere you want. You can insert it into your blog content to attract more visitors and generate more engagements.
An infographic is content that is easy to consume, and that can and should be used in your strategy to increase the volume of traffic on your website, generate leads, and strengthen the relationship with your potential customer. It is a material that you can start making today using free online tools like DesignCap.
Robin Khokhar is an SEO specialist who mostly writes on SEO. Thus sharing tips and tricks related to SEO, WordPress, blogging, and digital marketing, and related topics.


 How to Solve JPG Invalid Image File Header Problem?
Like your post. Lot of resources for the advance level editor. Thank you
An amazing collection of tips! So useful and informative!
Great post thanks for sharing this valuable piece of information with us all. As we all know how important an info graphic is when it comes to representation. Also designing Infographics for your content marketing is not easy it should be concise and totally related to your marketing campaign. Your post clearly provides the details needed to design a great infographics. Nice work and keep enlightening us like this in future as well.